
One model, several levels of detail
The classic dilemma of a flow diagram: detailed, it becomes unreadable; readable, it hides what matters. A hierarchy solves it by giving a node children. Collapsing means showing the parent in place of its children and summing their flows; expanding is the reverse, with no second file, no redrawing, and nothing to recompute.
Try it right now
Two models shipped with the application. Open one, right-click a node, and expand it.
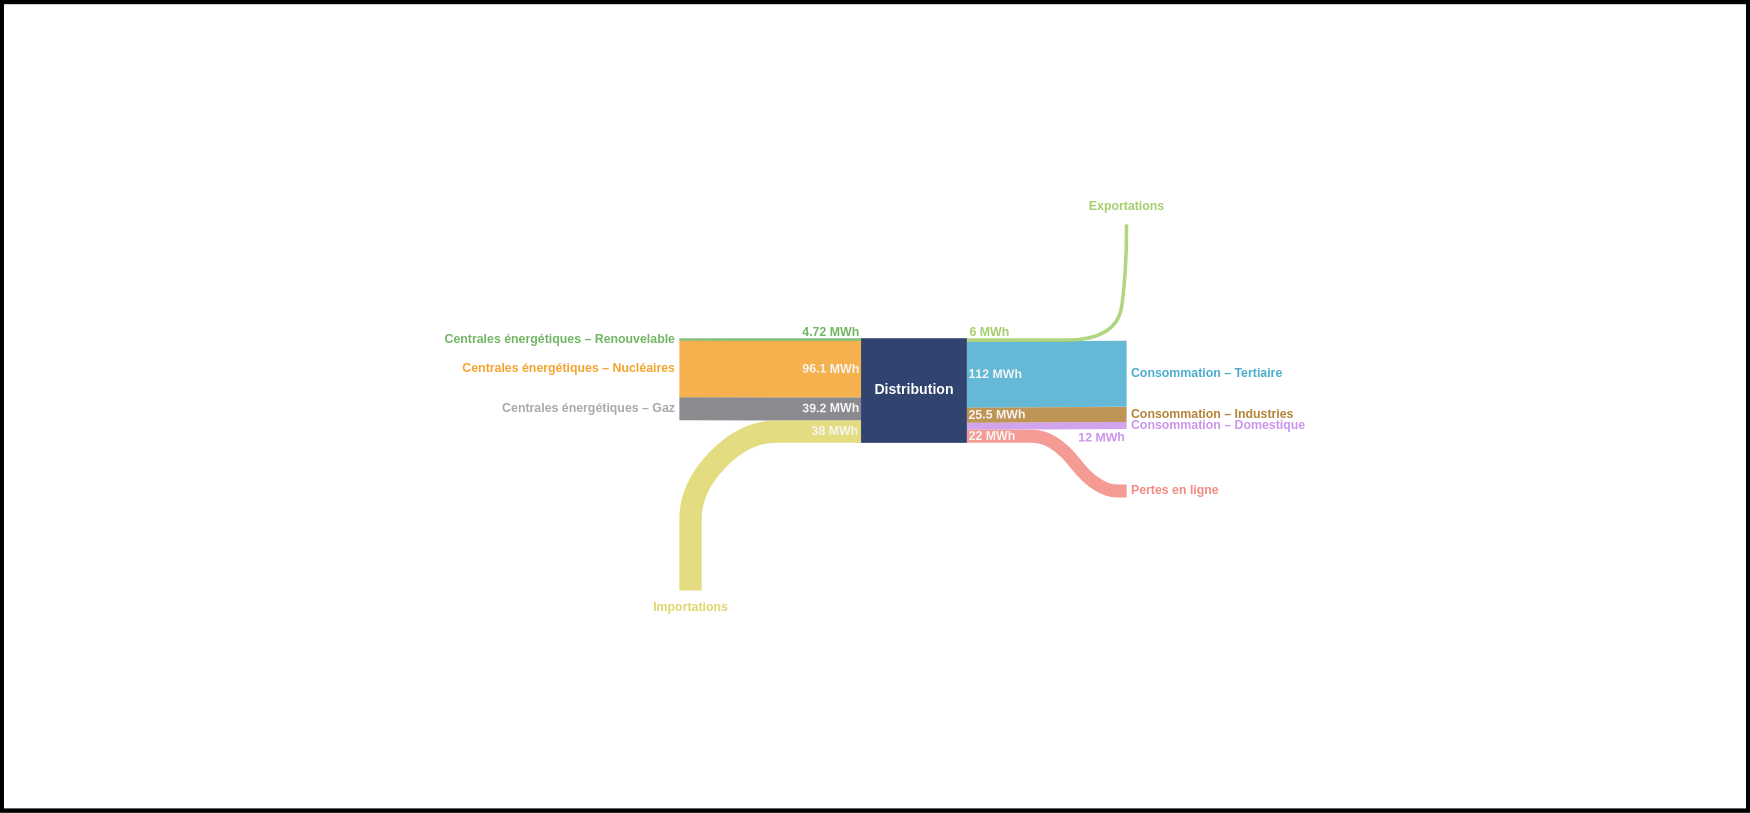
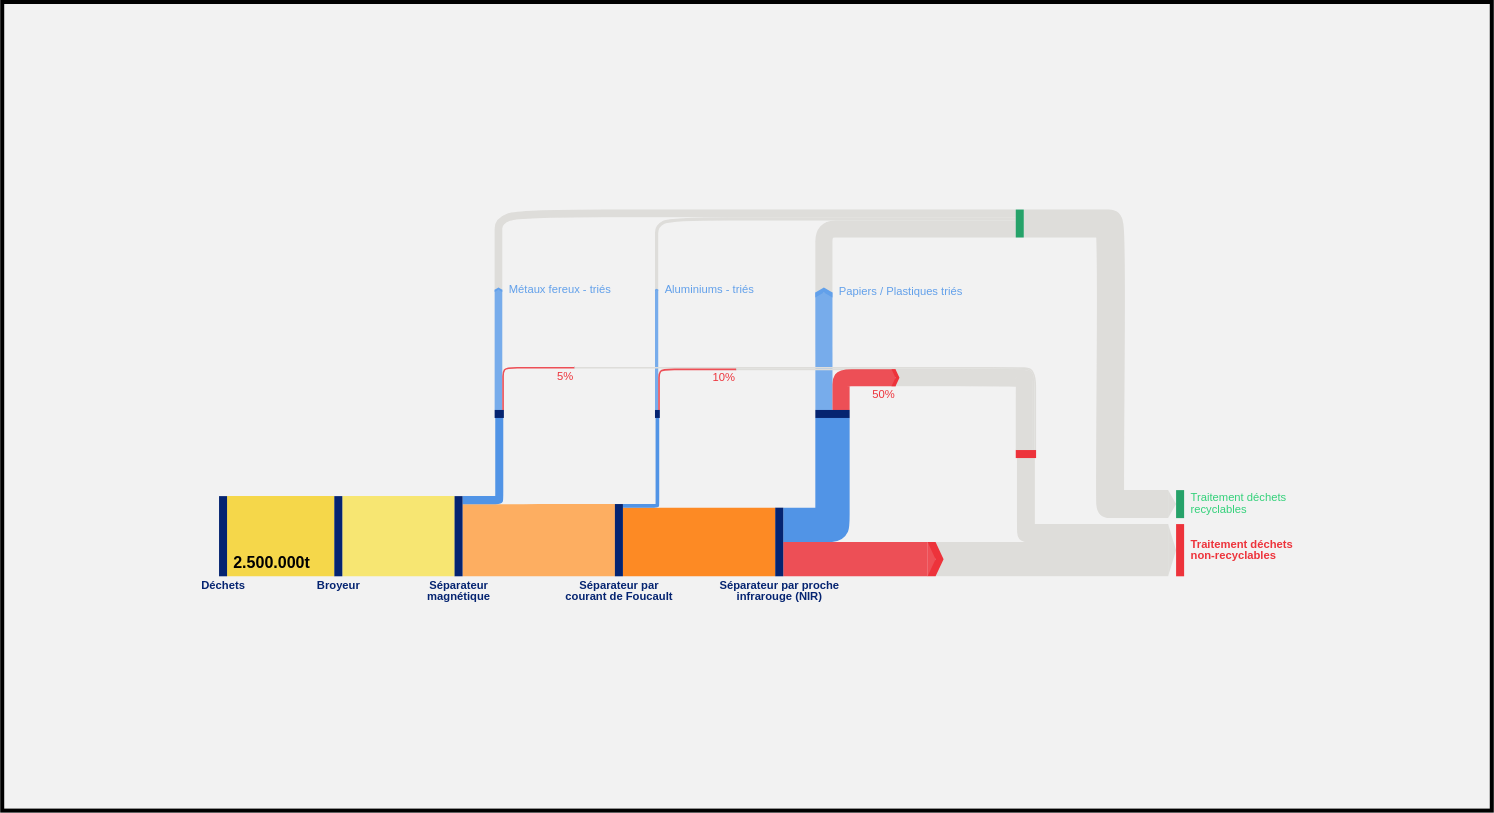
How a hierarchy is declared
In the workbook, the node sheet carries an aggregation level column. It reads simply: at a given level, a node is the sum of its disaggregated nodes at the next one. "Fruit" at level 1, "Apples" and "Pears" at level 2 just below, and the hierarchy exists. Nothing changes on screen: it is declared, not yet used.
That matters for large models. The structure is described in spreadsheet rows, not with the mouse, which is what makes diagrams of several hundred or several thousand nodes workable at all, since nobody would ever draw them by hand.
Two ways to navigate
The global level collapses or expands the whole diagram at once: the overview, then one notch down, then the next. Right-clicking a node expands that one only, in place, leaving the rest alone: the precise question you ask yourself when a figure surprises you. The diagram is then at mixed levels (one detailed branch inside an aggregated whole) and a single command flattens everything again.
This is not reserved to the author: in a published diagram, the reader finds "aggregate" and "disaggregate" in the right-click menu. That is what separates an explorable deliverable from a picture.
Two ways to cut the same total: parallel dimensions
One node can break down along two independent axes. "Fruit" breaks down by species (apples, pears) and by farming method (organic, conventional): two cuts of the same total, and you choose between them as you look. The right-click menu offers both dimensions, and detailing one does not prevent detailing the other elsewhere.
A cut of the cut: antagonistic dimensions
If "organic" and "conventional" are declared under "apples" and under "pears" rather than under "fruit", the two dimensions are no longer parallel: they stack. Detailing one then rules out the other at the same level. This is not a flaw, it is what your data says, but it is better known while building the file than discovered during the presentation. The rule fits in one sentence: two parallel dimensions start from the same parent, two antagonistic dimensions follow one another.
The layout follows
When a node expands, its children have to go somewhere. One global setting decides: take up the parent's vertical footprint (the diagram does not grow), use the positions you set by hand, apply a spacing of each child's own, or a constant one. An enclosing frame can also surround a group of nodes and follow them as they move, showing a perimeter without freezing it.
What about the computation
Hierarchies are not only about display. Data rarely arrives at a single level of detail (a known total at the top, half the detail at the bottom) and reconciliation works on both levels at once: consistency between a parent and its children is one of the equations to satisfy.
Going further
Creating and editing a hierarchy belongs to the MFASankey Dataviz edition; navigating one stays open to everyone, including in a published diagram (see pricing). The fifteen matching exercises are inside the application: Help → Tutorials → Labels and hierarchies.
See also labels, which classify without replacing. Both are driven from the same panel, but they do different work.