
One diagram, several readings
A label classifies an element: a node, a flow, a value. That is what lets you filter, colour and compose a legend. And when a group of labels is declared as a dimension, it does far more: the same diagram carries several sets of figures (2015 to 2022, North and South, business-as-usual and sufficiency) and you switch between them in one click, without changing file.
Try it right now
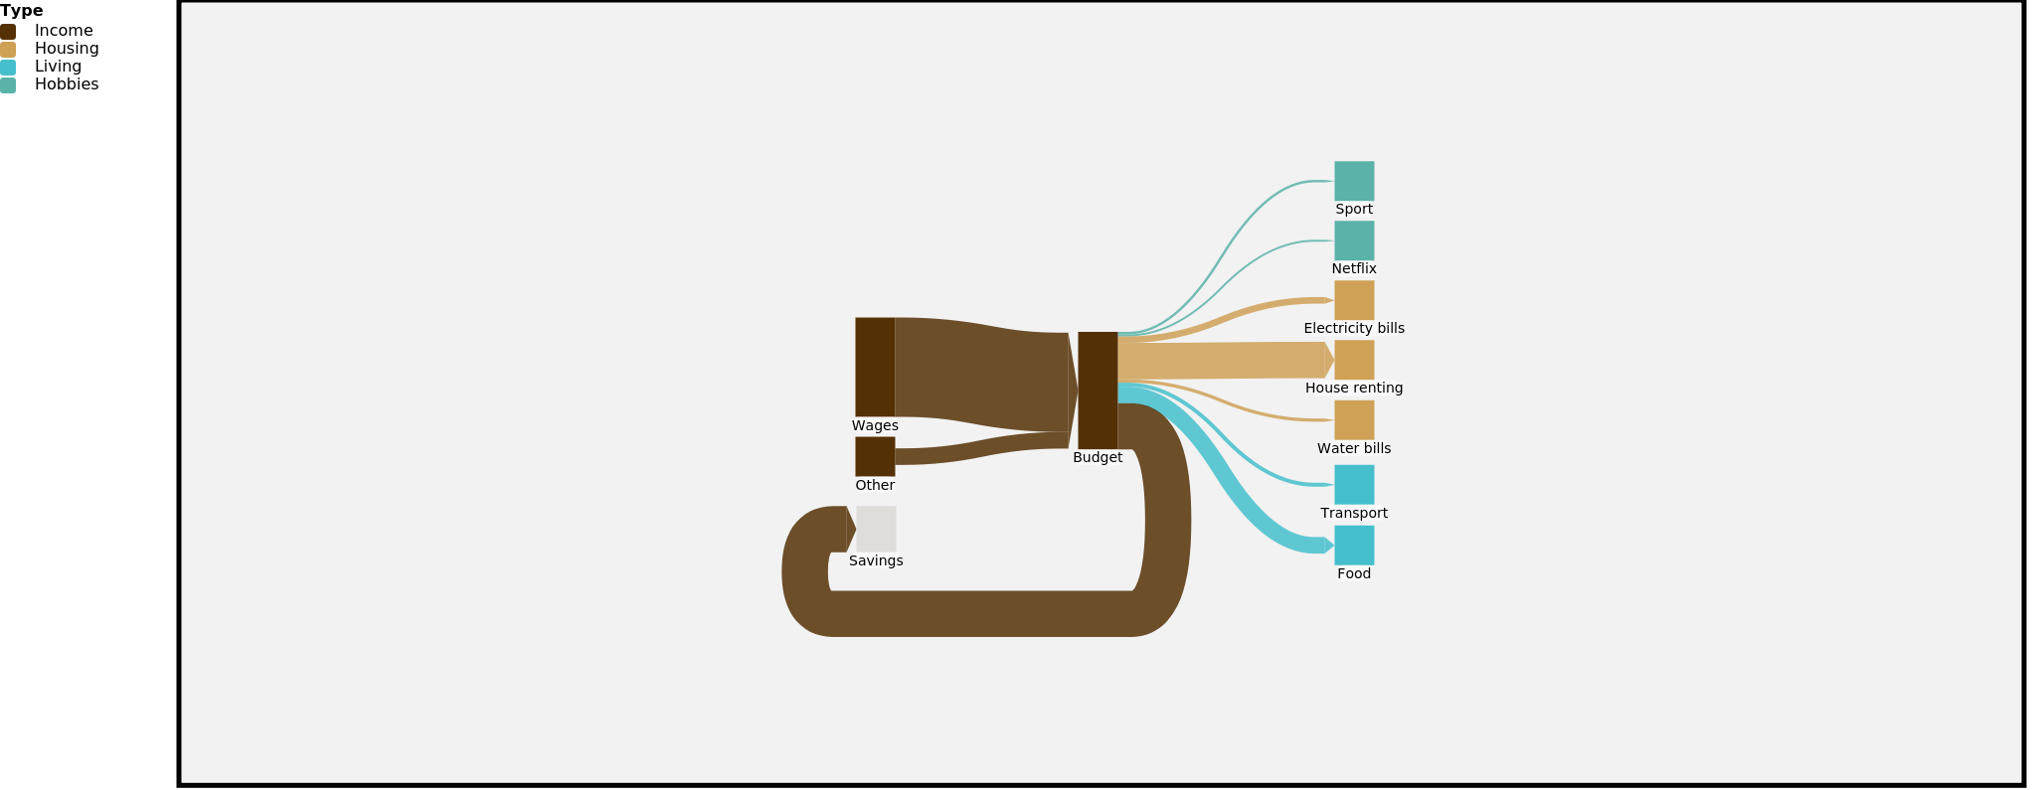
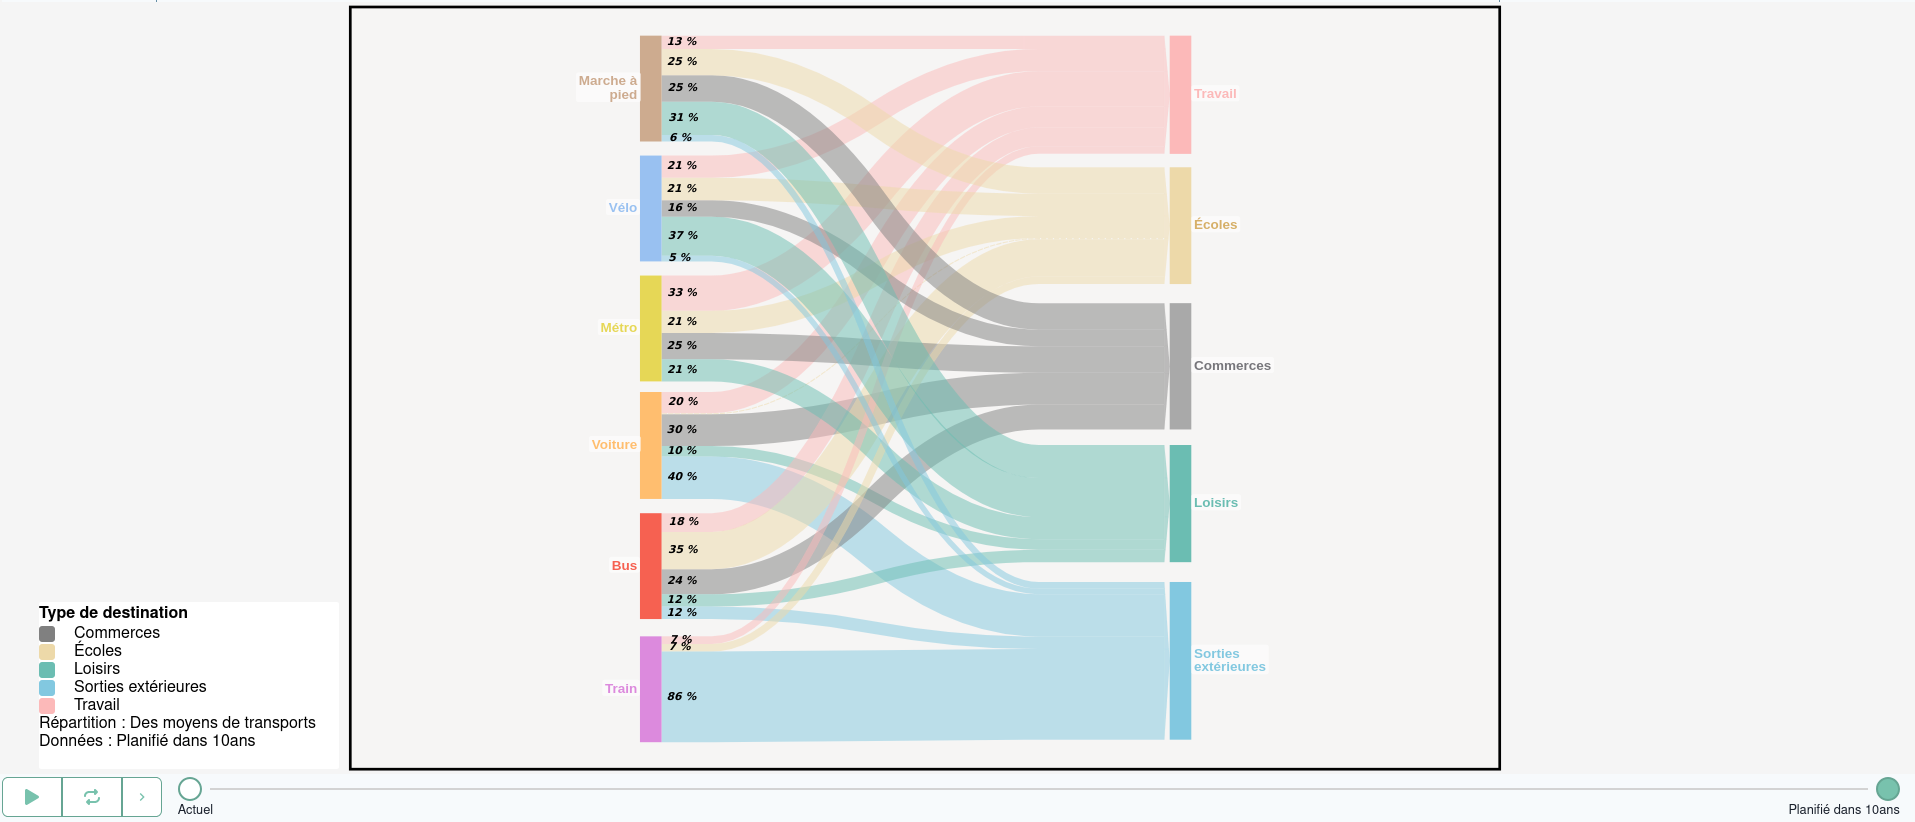
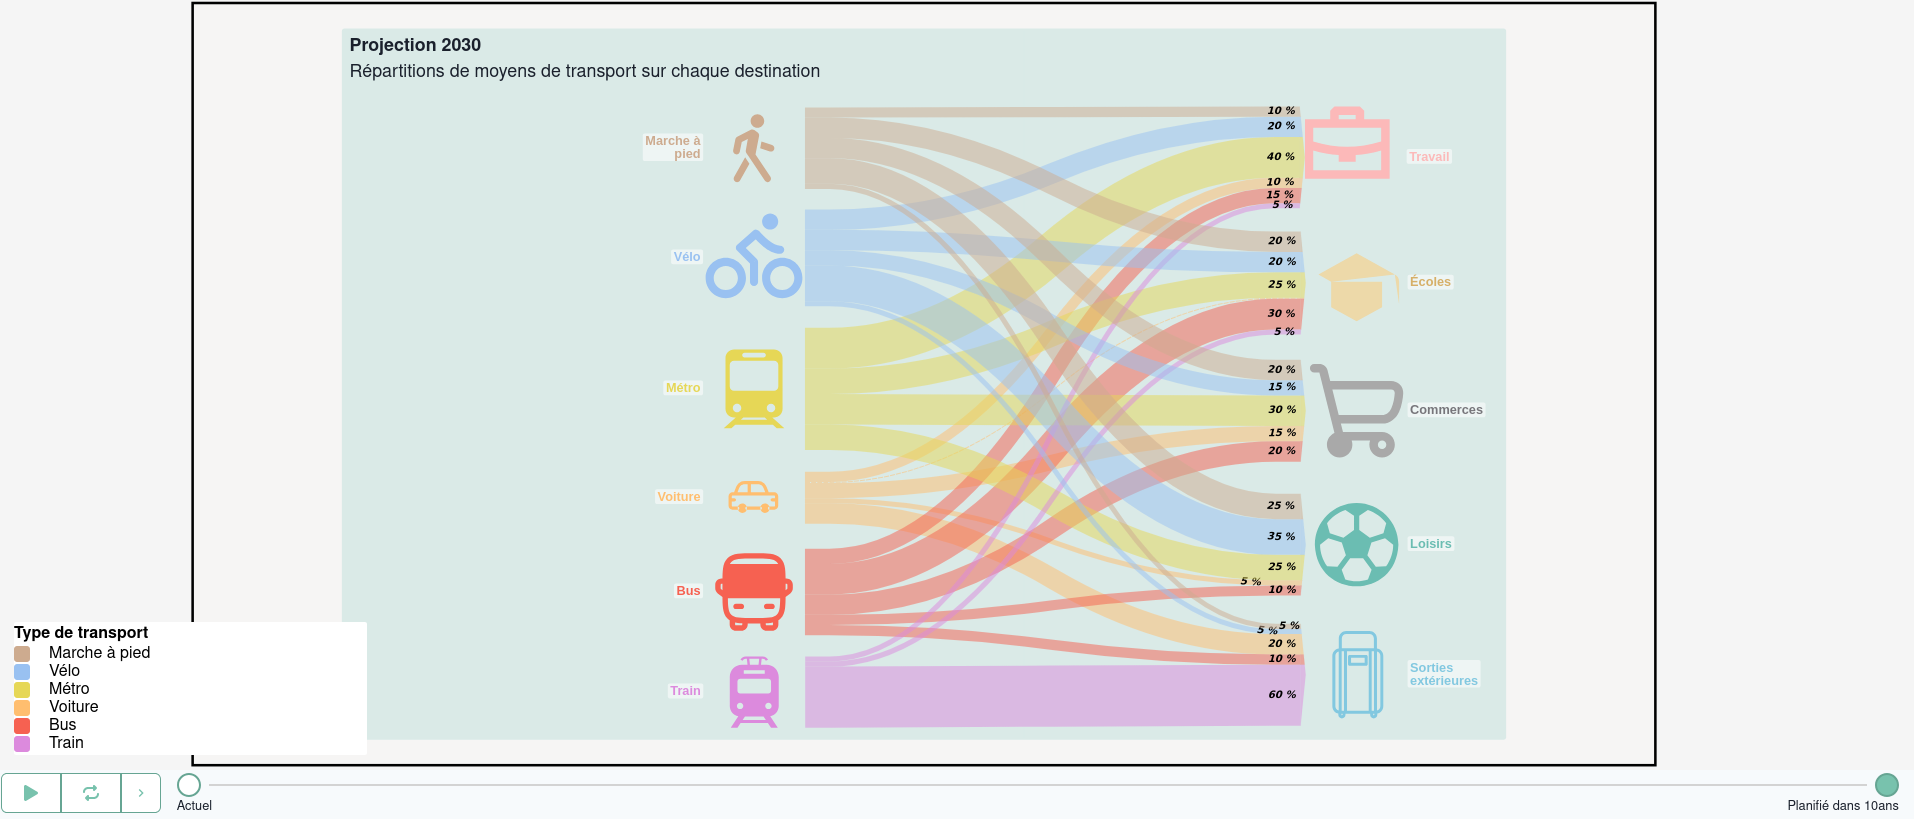
Three models shipped with the application, labelled and filterable.
Free group or dimension: the distinction that matters
A free group is not combinatorial: its labels coexist on the same drawing. "Upstream", "Processing", "Downstream" colour and filter a diagram that stays whole. One element can even carry several labels of the group, and so appear under two filters at once.
A dimension is combinatorial: the diagram shows one slice at a time. Year × Territory means one value per combination, and a selector that changes every value in the diagram at once. This is exactly what a drawing tool cannot do: there, a second year is a second file.
| Free group | Data dimension | |
|---|---|---|
| What it classifies | Nodes or flows | Values |
| On screen | Labels coexist on the same drawing | One slice at a time, you switch |
| Used for | Filtering, colouring, legends, grouping a reading | Years, territories, scenarios, products (crossed freely) |
| Example | Upstream / Processing / Downstream | 2015…2022 × North / South |
A checkbox moves a group from one to the other. From dimension to free group the conversion is lossless; the other way round, whatever was not broken down is poured into an "Unassigned" label created for the occasion.
Applying labels without a thousand clicks
On a single element, a dedicated tab ticks the labels; on a multiple selection, it edits the whole batch at once. For large models, a selector builds the selection on its own (by element type, by label group) and the selection accumulates across types. And like the rest, all of it can be declared in the workbook too: one row per group, with its labels, its long names and its palette.
What labels do next
Colour and filter. Every label carries a colour; the diagram can colour flows by their label and hide, in one click, everything outside a category. Standard palettes apply to a whole group at once.
Compose the legend. The legend regenerates from the current groups and labels, then behaves like any graphical element: orientation, width, font, background, border. The order of groups, and of labels within a group, is set by hand.
Appear on screen. Each group picks its own form: a single choice, several checkboxes, or (for a dimension) a selector placed in the top bar, within immediate reach during a presentation, or even a sequence that plays the labels one after another with an adjustable delay. A slideshow of the years with nothing to prepare.
Write the captions. A node can display the long name of its label instead of its own, or combine both in a template, handy for reading a diagram along a nomenclature without renaming anything.
Carry units. A group of flow labels can distinguish the nature of the values (tonnes, m³, tCO₂, euros) with the matching scale. That is what lets a material balance and a monetary balance live in the same model.
And the computation
Dimensions are not mere decoration: reconciliation works slice by slice. Each year, each scenario is a system of equations in its own right, solved on the same structure. That is what makes a time series maintainable: the structure is written once.
Going further
Creating and editing a label group belongs to the MFASankey Production edition; filtering and navigating stay open to everyone, including in a published diagram (see pricing). The exercises are inside the application: Help → Tutorials → Labels and hierarchies.
See also hierarchies, which do not classify but replace: aggregating means showing the parent in place of its children.