You know your euros.
Do you know your tonnes?
Our craft is material flow analysis: counting what comes in, what goes out, what gets lost. Where a price exists, the tonnes give you the euros. Elsewhere they don't: rainwater has no price, a farm subsidy has no tonnes. We keep both ledgers in one model, without forcing either into the other. To get started, our Sankey diagram editor is free, online, no account needed.
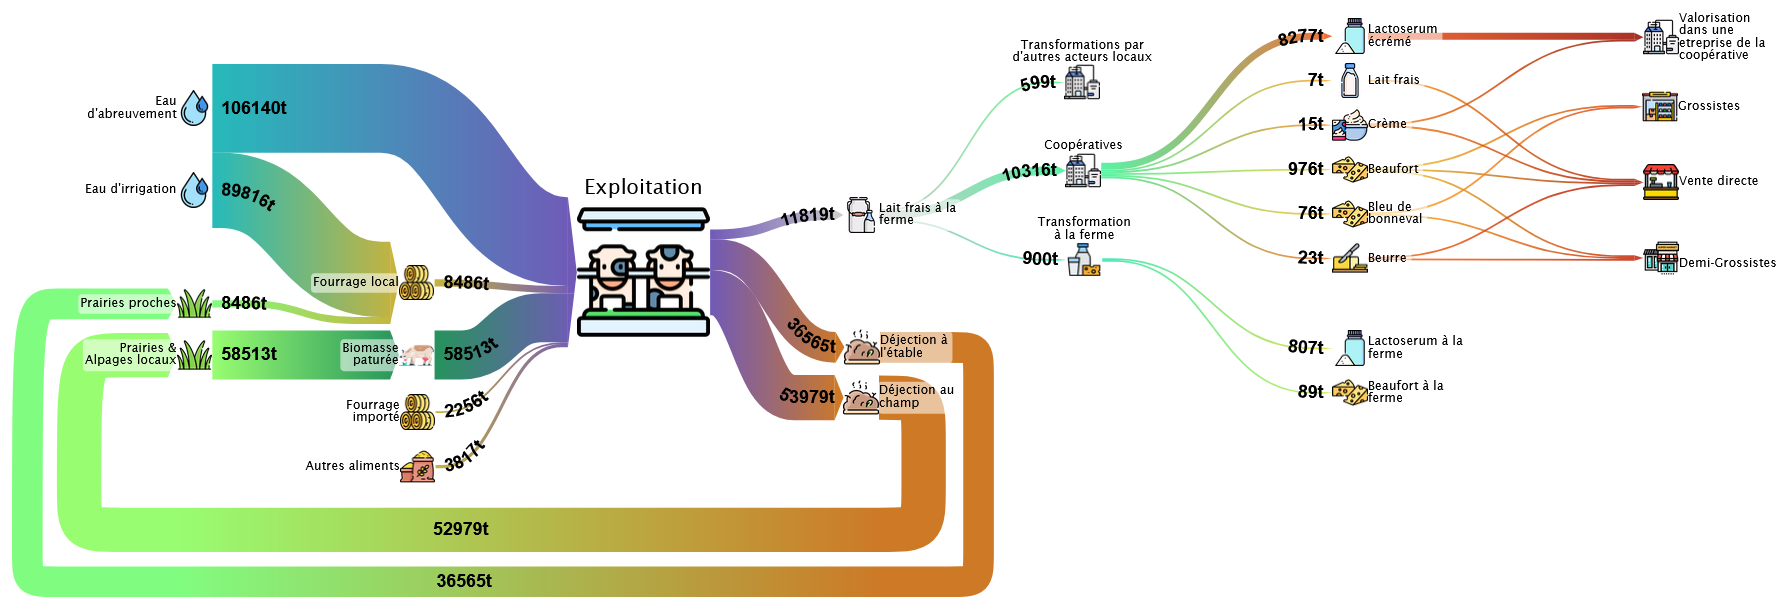
The same flows in tonnes…
× price €/t
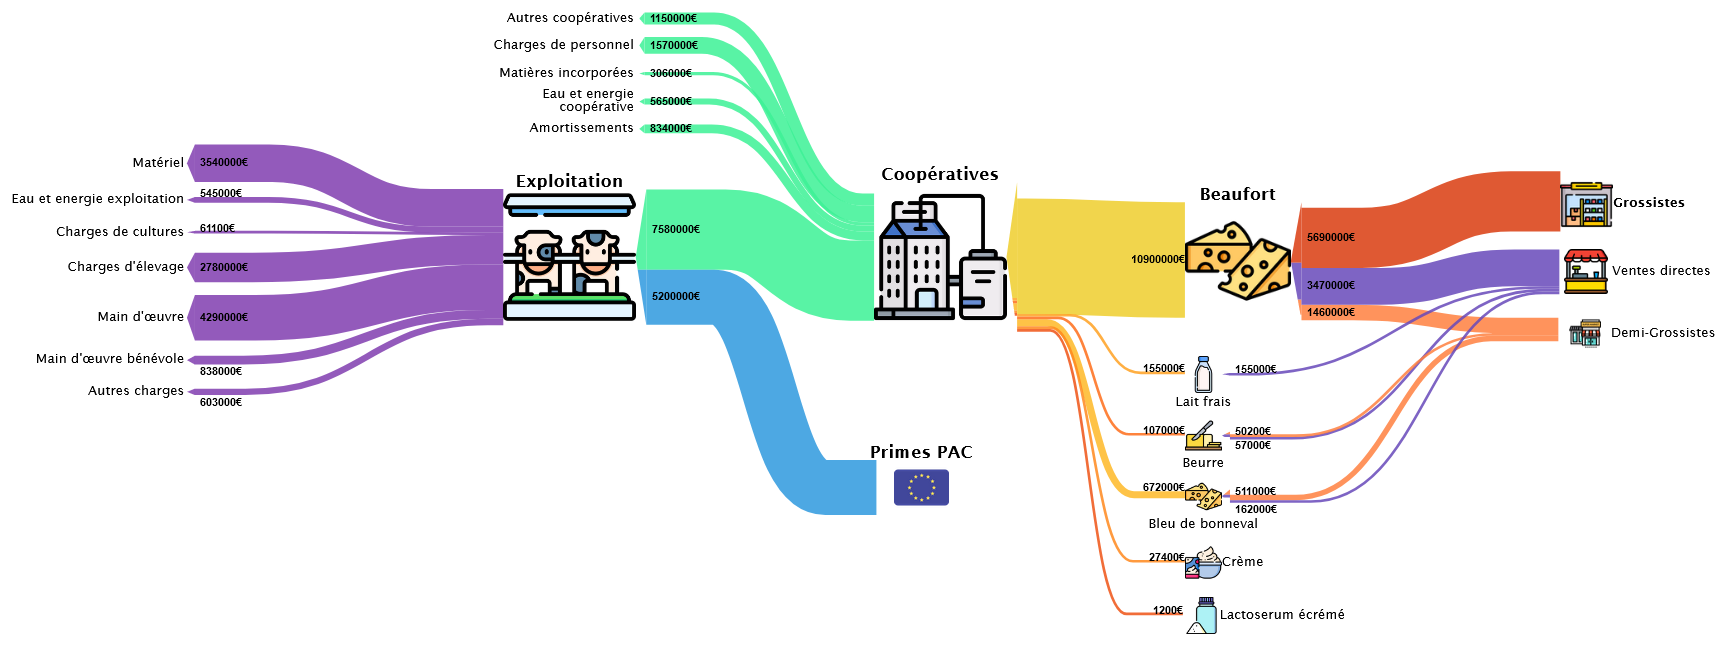
…and in euros
What the flows reveal
Two readings of the same model, and what only ever appears on one side.
Euros, right to left
Where the money comes from, where it goes. A sector that depends on one subsidy, an outlet that weighs too much: financial risks show at a glance.
Tonnes, left to right
What comes in, what goes out, what gets lost. An imported resource, water, energy: physical dependencies appear on the same diagram.
And what exists on one side only
Rainwater, grazed biomass, manure spread on the fields: tonnes with no price. Farm subsidies, volunteer labour: euros with no tonnes. These are often the flows that weigh heaviest: a model that drops them because they don't convert misses the point.
Together the three show where your supply chain is solid, and where it breaks.
From raw data to a published diagram
Import, reconciliation, styling, publication: watch the full pipeline unfold, from raw data to a published diagram.
At the heart of the pipeline, the computation that makes your numbers consistent:
This equality only binds the flows that have a price. A material flow with no price, a money flow with no matter behind it: the model carries them as they are, without inventing a counterpart.
At every scale
Statistics exist at the national scale. Decisions are made in a territory. Our downscaling method, born from Inria research on territorial metabolism, distributes national flows region by region, down to the territory, with confidence intervals. The same model reads from the whole country to a single valley: zoom out for the global stakes, zoom in for the local risks. See the method →
One engine, three levels of depth
OpenSankey and the two MFASankey editions share the same engine. Start with a drawing. End with a defensible material balance: each tier brings your diagrams closer to the full model, where materials and value line up.
OpenSankey
The free, open-source editor. Draw and style Sankey diagrams, import 3-column data, export images. No account needed.
Start drawing
MFASankey Dataviz
Professional dataviz: hierarchical nodes with drill-down, data tags to switch years/scenarios, views, published interactive diagrams you can embed anywhere.
See pricing
MFASankey Réconciliation
The MFA engine: data reconciliation under constraints, uncertainty propagation, completion from as little as 10% of measured data. Excel in, balanced flows out.
See pricingComing from another tool?
Your existing work opens directly, with no retyping.
MFASankey is the new generation of Sankey and material-flow-analysis software. It inherits what its elders do best (the immediacy of SankeyMATIC, the scientific rigour of STAN, the industrial polish of e!Sankey) and adds what none of them offer: unfolding a node into its sub-flows and folding it back, computing intervals when the data is uncertain, and reconciling tonnes, prices and euros.
From STAN
Open your .smfa files directly and keep working on your models in the
browser.
From SankeyMATIC
Paste your source [value] target text as-is, including colors and layout
settings. Then make it interactive.
From e!Sankey
Browser-based, transparent public pricing, and an actual reconciliation engine: not just balance checks.
What we learned from e!Sankey →Already running Power BI? It isn't a tool you migrate from: it shows the figures you have, we compute the ones you are missing. Why you want both →
Built on real studies, not demos
Fifteen years of cumulated experience mapping agriculture, forestry, waste, biomass and energy flows for public agencies and industry. Studies that already link tonnes and euros: physical and economic supply-use tables, value build-up along the forest-wood chain, carbon coupling.
Energy flows in France: Metabol'Heat project
2025–2026
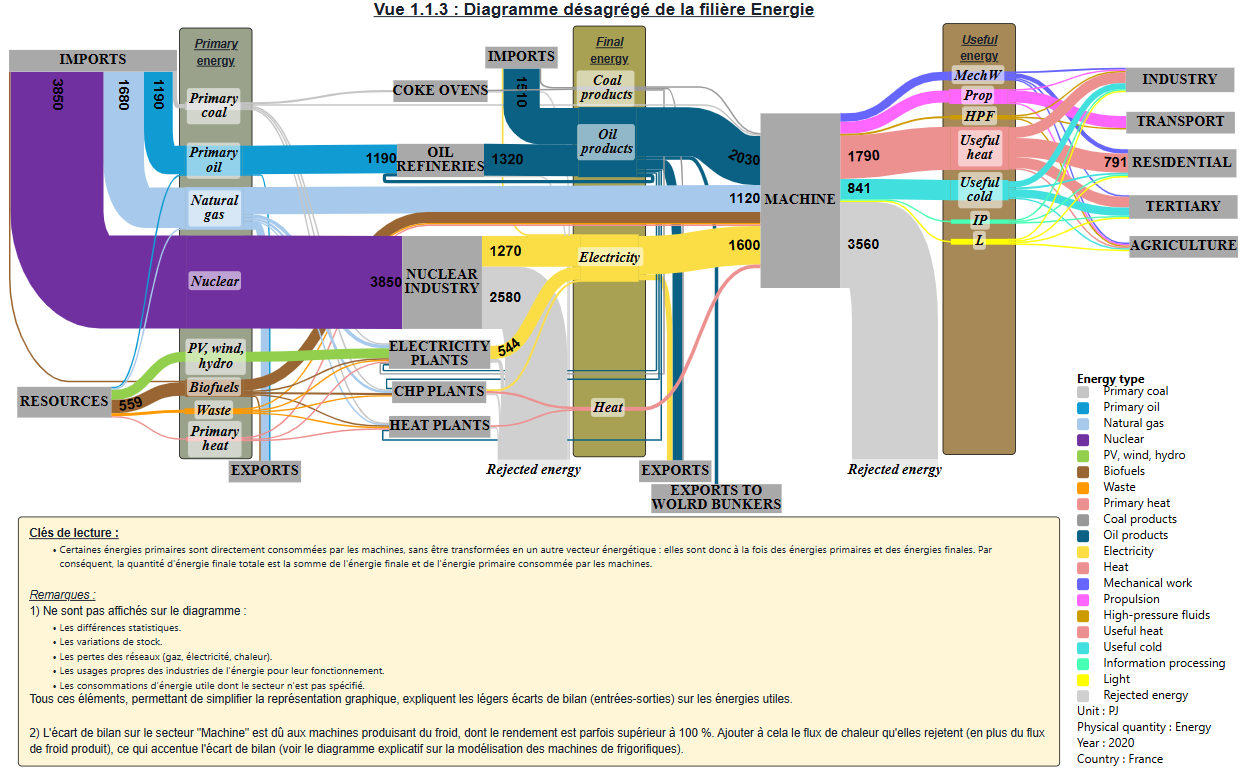
Half of France's final energy consumption goes to thermal uses — yet heat flows remain the least well described part of the energy system. For the CNRS Environnement Ville Société laboratory's ANR project Metabol'Heat, this national map follows energy from primary supply to end uses, useful and dissipated heat included.
Waste flows of the Pays Voironnais
2024–2026
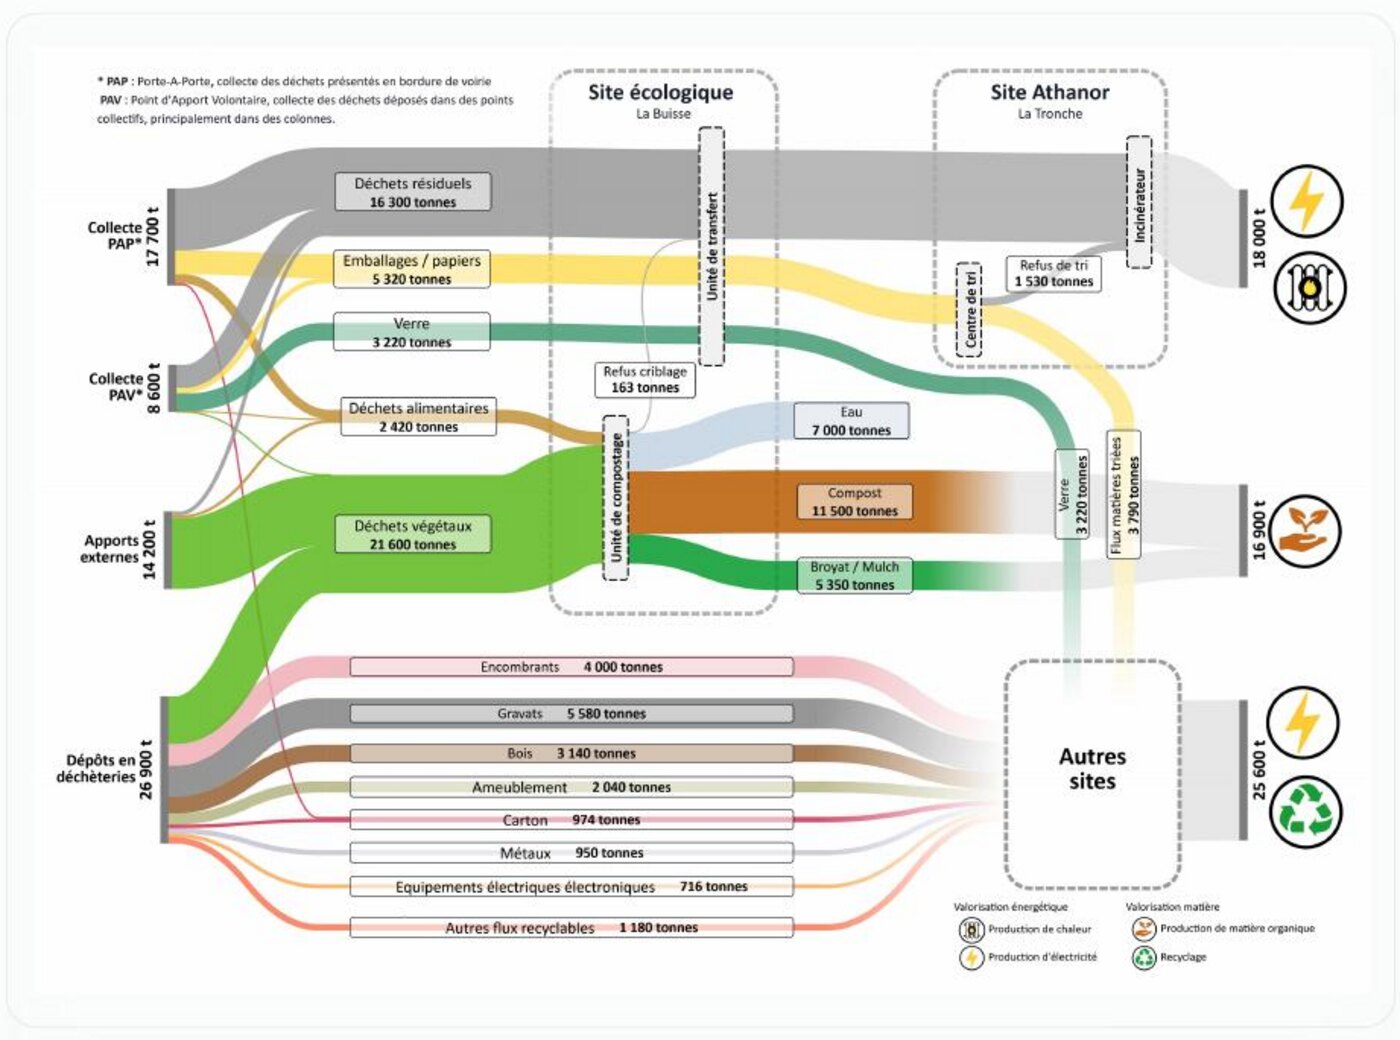
What becomes of a territory's waste once it has been collected? For the waste management department of the Pays Voironnais urban community — 31 municipalities, 95,600 inhabitants, an in-house service handling more than 53,000 tonnes a year — this publication retraces three stages of a single journey. First a demonstration: the "flows" double page of the annual report, a process diagram whose links all have the same thickness, turned into a Sankey where proportions are finally carried by the drawing. Then an interactive map, commissioned in 2024, whose single flow graph reads from four angles — geographical destination, collection mode, waste type, and the crossing of the last two.
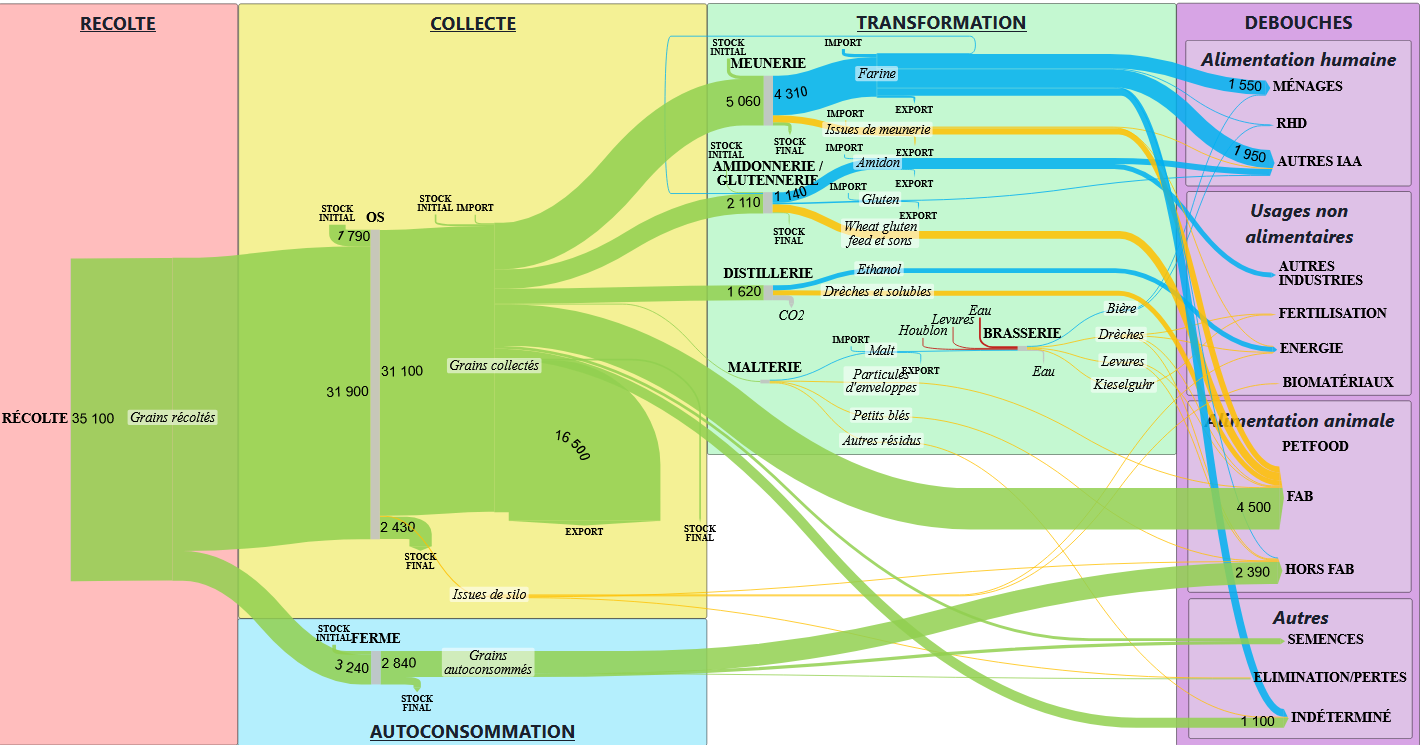
All of French agriculture, flow by flow: SOCLE project
2025–2027
What the fourteen main French agricultural supply chains produce, process, trade with the world and consume: 51 reconciled diagrams, from an overview of all agriculture — plant and animal supply chains side by side — down to each supply chain, partner countries and animal feed.
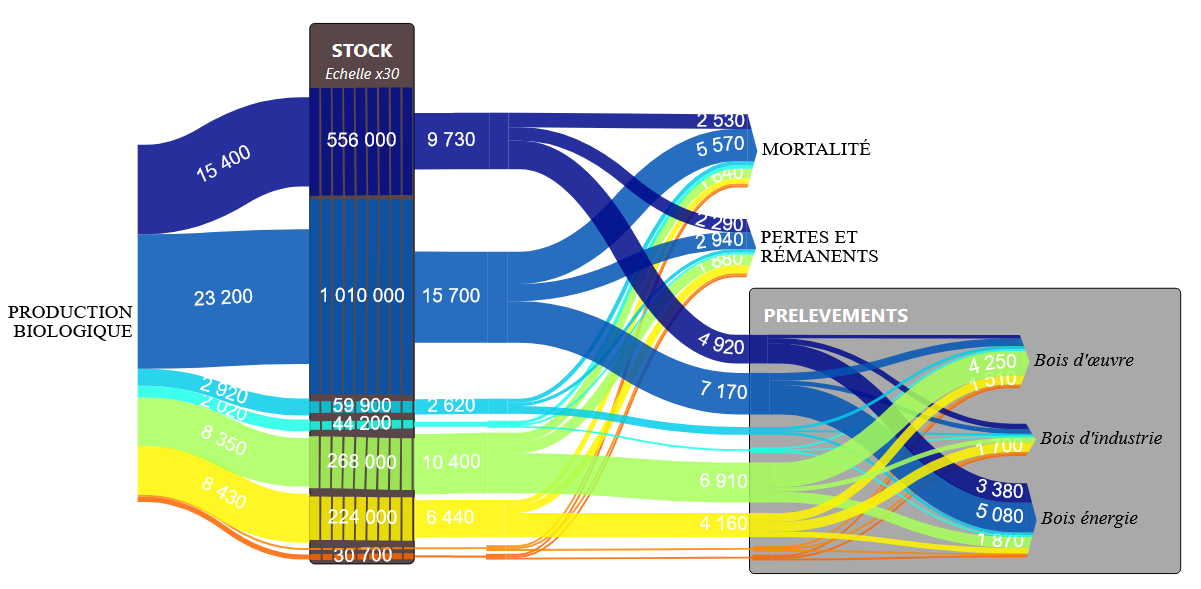
Forest-wood flows: BACCFIRE project
2023–2025
Four years of work on the fate of carbon along the flows of the French forest-wood chain: the BACCFIRE project (ADEME GRAINE, coordinated by the ONF) consolidates the methods for assessing wood's three climate effects — forest sequestration, storage in products, substitution of more emitting energy and materials.
They trust us
National agencies, research institutes, technical institutes and local authorities. Who they are, and what each one produces →





The method, in video
Why material flow analysis and Sankey diagrams help steer sustainable supply chains: explained on the wood value chain.
Who we are
TerriFlux is a deep-tech worker cooperative (SCOP) spun off from Inria, the French national institute for computer science. Our reconciliation engine comes from peer-reviewed research on territorial metabolism. We work with ADEME, INRAE, IGN and regional agencies, and everything we build ships in the open: the editor is open source.
Nine R&D projects since 2022 (with ADEME, INRAE, CNRS and Bpifrance) and open-access publications back everything we ship.
Why we do this
Physical flows have never been larger nor more invisible, and no statutory accounting measures them. Our manifesto.
Read the manifesto →Who will answer you
A small team doing all of it: the method, the code, the studies. The people, their backgrounds, and the research partner who links us to the lab.
Meet the team →Where it comes from
From a 2016 Inria PhD to contracts with IGN and FranceAgriMer: thirteen years of flow analysis, projects and publications included.
Our story →