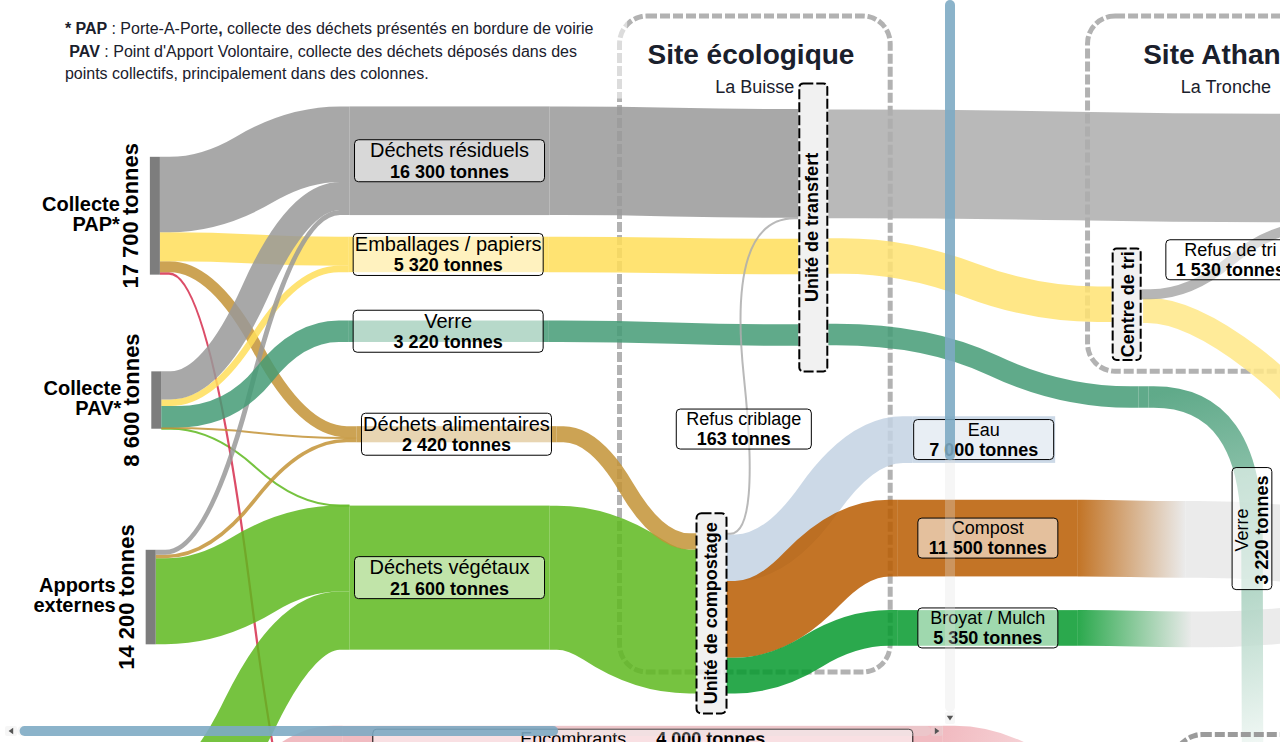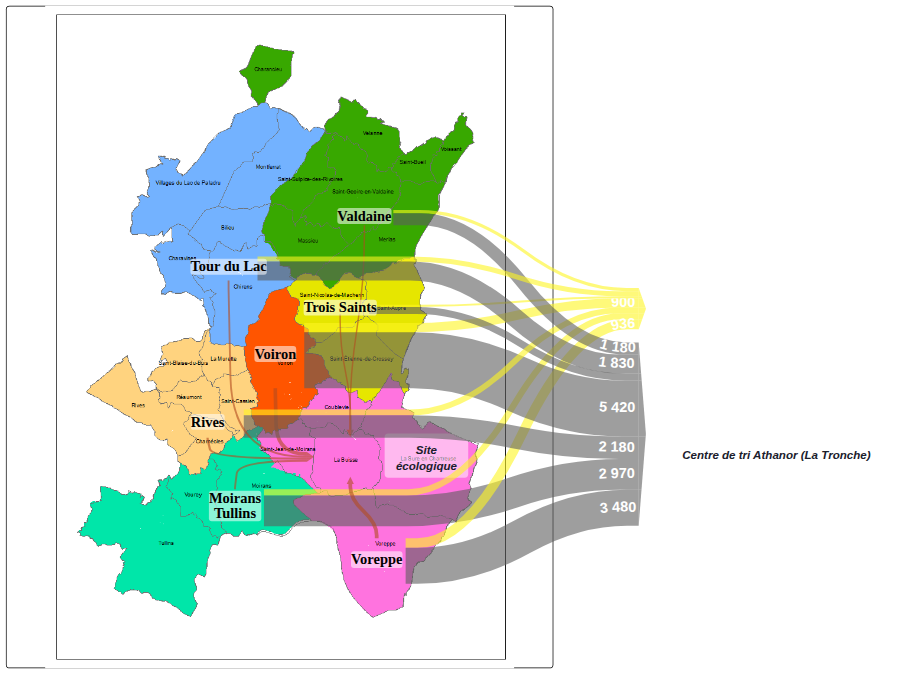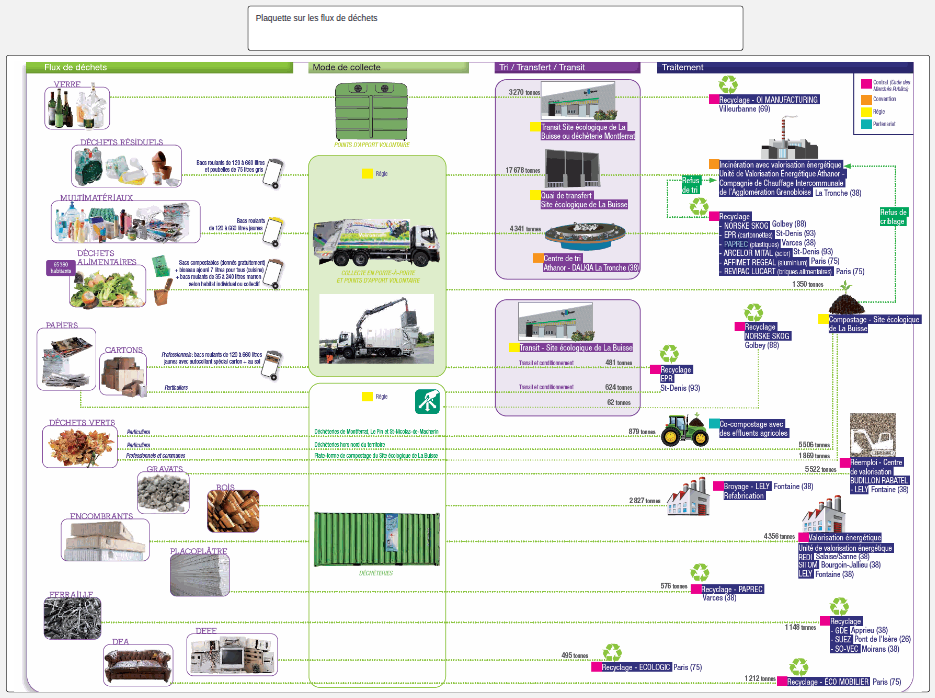
What becomes of a territory's waste once it has been collected? This publication gathers the Sankey diagrams produced for the Waste Management Department of the Pays Voironnais urban community (Isère, France), where the width of every flow is proportional to its tonnage: what is recycled, composted, incinerated or landfilled can be read at a glance, as can the sorting residues.
The three pages are not three versions of the same drawing. They retrace three stages of a single journey, from demonstration to printed page.
The department's annual waste report has long devoted a double page to the territory's flows. It is a process diagram: every link has the same thickness and the tonnages are written alongside, so nothing shows that one flow weighs ten times another. It can be read on pages 16-17 of the authority's 2024 annual waste report (in French). The page Vue globale du territoire shows what that diagram becomes once turned into a Sankey — the same story, with the proportions carried by the drawing rather than by the figures. It was made before any commission, to make the case concrete.
In 2024 the authority commissioned an interactive map of its service. The point was no longer to demonstrate but to explore what the tool allows: the same flow graph is read from four angles, gathered in the page Cartes des flux 2024 — by geographical destination, by collection mode, by waste type, and by crossing the last two. The view selector switches angles without changing the diagram.
In 2026 the department asked for the double page of its annual report to be replaced. The diagram is no longer an exploration tool but an A3 page to be printed, laid out in the report by the authority's communication agency. That is the page Flux de déchets 2026. The constraint changed everything: no hovering or zooming to make up for a difficult read, a graphic charter to respect, and tonnages that must fit the width of a page.
Tonnages come from the authority's waste department and its collection and treatment operators. They are reconciled: since the available data are heterogeneous, all flows are adjusted so that the input-output balance of every node is consistent, while staying as close as possible to the measured values.
The territory covers 31 municipalities and about 95,600 inhabitants; the service is run in-house and handles a little over 53,000 tonnes a year.
Client: Communauté d'agglomération du Pays Voironnais — Waste Management Department. Diagrams: TerriFlux, with OpenSankey.