Stage 2 of the journey (see the site home page): the first commissioned work.
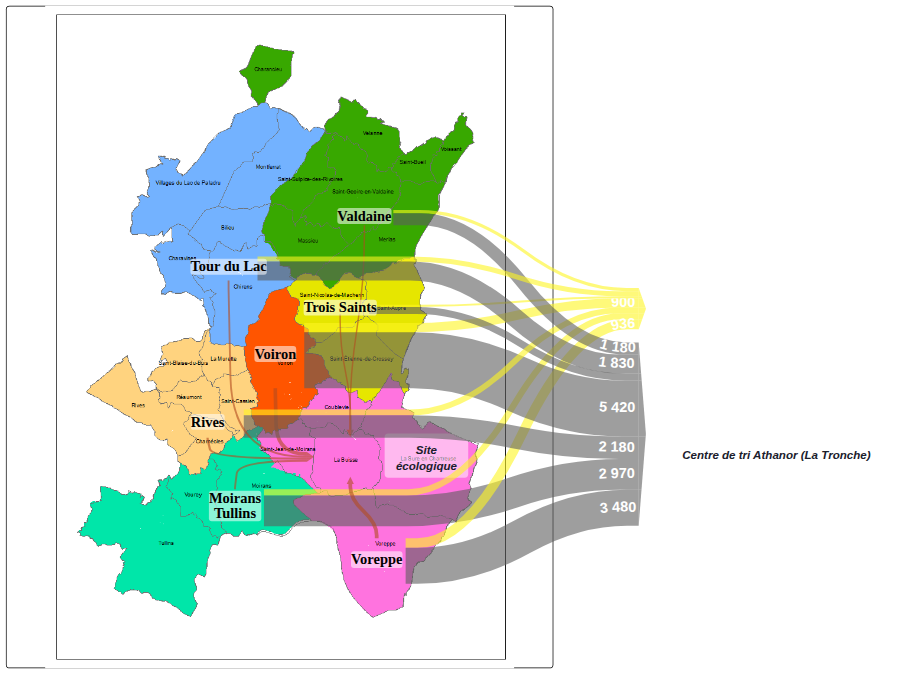
In 2024 the Pays Voironnais commissioned an interactive map of its waste flows from TerriFlux. The aim was no longer to demonstrate the principle but to see what the tool actually allows, on the territory's own data.
A single graph — 30 nodes, 144 flows — but four readings, selected in the view selector:
Switching view does not change the diagram: it is the same set of flows, highlighted differently. That is what sets this page apart from the other two, where the diagram is fixed.
This page was delivered as a web page for embedding in the authority's own site. It remains as handed over in October 2024; the tonnages have not been updated since.
Client: Communauté d'agglomération du Pays Voironnais — Waste Management Department. Made by TerriFlux, with OpenSankey.