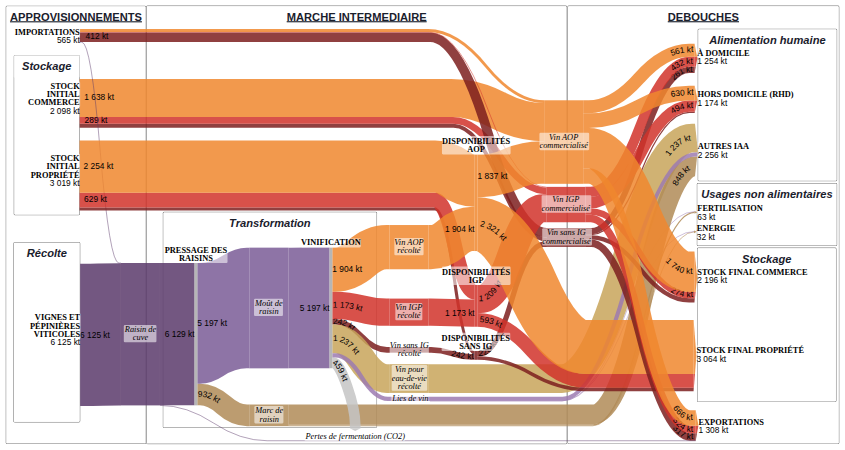
The flow diagram presenting the results for this supply chain, produced as part of the SOCLE project, offers a complete view of how material circulates, from supplies to final outlets. It is a Sankey-type representation: the thickness of the arrows is proportional to the quantities (in kilotonnes, kt), making it possible to grasp at a glance the relative weight of each segment.
This diagram aims to represent the supply chain as a whole at the level of detail allowed by the available public data. Wine is described there through two cross-cutting breakdowns of one and the same total volume — by colour (red / rosé / white) and by segment (AOP / eau-de-vie / IGP / VSIG): two views are therefore offered, "Detail by segment" and "Detail by colour", selectable in the view selector above the diagram.
The diagram represents all the material flows within the wine supply chain in France, for the 3 wine years studied in the SOCLE project: 2015/16, 2019/20 and 2023/24 (select the desired wine year in the timeline below the diagram).
Supplies include the national production of wine grapes, supplemented by grape trade, then the wine harvest resulting from pressing and winemaking. The intermediate market highlights pressing (separation of must and pomace), winemaking (production of wine and lees, and release of fermentation CO₂), the availabilities and the two levels of stocks (producer and trade). The outlets include consumption (at home and out of home), exports, the distillation of eaux-de-vie (Cognac, Armagnac), and the recovery of the co-products (distilling, fertilisation, composting, anaerobic digestion).
The thickness of the flows makes it possible to identify the main recovery routes, the weight of exports and distillation, and the place of co-products in the balance of the chain.