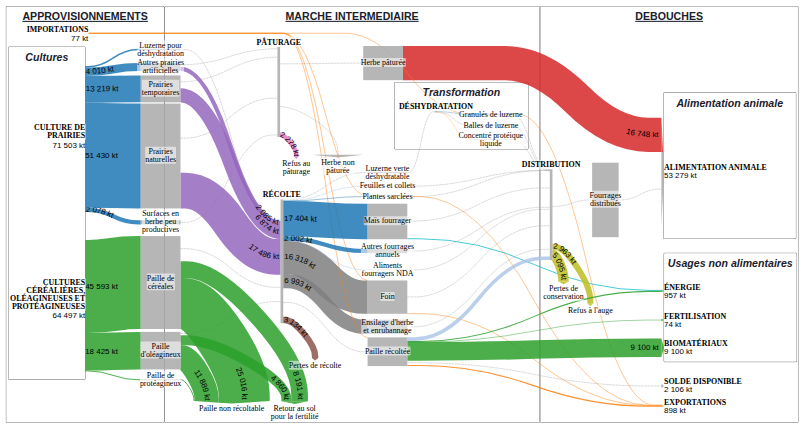
The AF-Filières (Supply Chain Flow Analysis) methodology, implemented in the SOCLE project, aims to reconstruct all the flows of a supply chain by aggregating, structuring and analysing all the available information. It consists in gathering all the relevant data about a given sector into a single, hierarchical model that links every piece of information together. This systematic cross-checking makes two essential operations possible: 1. checking the internal consistency of the data and, where necessary, reconciling it; 2. determining missing values, either precisely or as intervals when some indeterminacy remains.
The Sankey diagrams presented in the "Method and sources" section illustrate each step of this process, relying directly on the data actually used in the SOCLE model.
(Associated diagram: Sources)
This first phase starts with an inventory of all the relevant public and sector-specific sources describing the supply chain in France. The associated diagram shows, for each documented flow, the sources used and their characteristics. Forage production comes from Agreste's annual agricultural statistics; straw production and the breakdown of its uses, from FranceAgriMer's national biomass resources observatory (ONRB); trade, from customs (Eurostat Comext); animal intake, from the national emissions inventory (CITEPA / OMINEA); the loss and refusal coefficients, from references of the Institut de l'Élevage, INRA and the GIS Avenir Élevages. The diagram also makes it possible to display the type of data collected (direct value, or allocation and yield coefficients). The raw data from each source can be consulted in the corresponding sheet of the model's Excel file.
Because the collected data generally does not cover the whole supply chain, this step also includes structural completion: additional flows are added to ensure the continuity of the chains and to materialise the segments lacking information.
At the end of this phase, the whole knowledge perimeter is mapped.
(Associated diagram: Method)
Based on this complete structure, the flows for which reliable data exists are consolidated. Once the model has been made consistent, the missing flows are determined using material balances and relationships between flows.
In this supply chain, determination by balance plays a central and revealing role. Agricultural statistics explicitly state that it is not possible to measure the share of grass actually removed, nor the share actually consumed. Yet, comparing the available grass production with the actual consumption of the animals (itself estimated by the emissions inventory), a gap appears that varies by a factor of three from one year to another: small in a drought year, huge in an exceptional grass year such as 2023, even though the herd is shrinking. No fixed loss rate can explain such a variation. From this the model deduces, by balance, a flow of grass not removed — the grass that grows but that the animals, too few in number in good years, cannot consume.
(Associated diagram: Confidence level)
The last diagram offers an overall view of the results, enriched with a global reliability indicator for each flow. This reliability is based on several criteria: quality and precision of the sources, closeness of the collected data to the project's perimeter, magnitude of the discrepancies, width of the indeterminacy intervals.
How to read the reliability levels:
This diagram makes it possible to identify the segments that are well documented (production of forage maize and lucerne, foreign trade, straw production by field crops) and those that remain more exploratory (the available production of grassland, the share of grass not removed, the fine breakdown of straw uses, and the reconstruction of the 2015-16 crop year for straw).