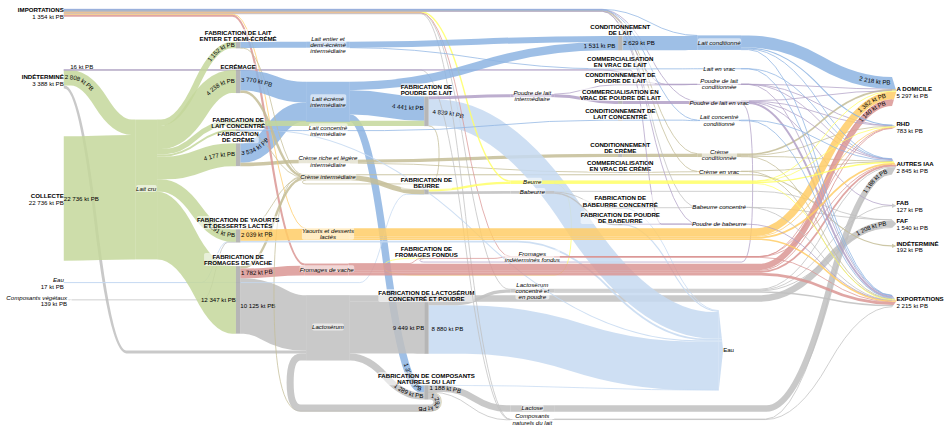
The flow diagram presenting the results for this supply chain, produced as part of the SOCLE project, offers a complete view of how material circulates, from the collection of raw milk to final uses. It is a Sankey-type representation: the thickness of the arrows is proportional to the quantities, making it possible to grasp at a glance the relative weight of each segment.
This diagram represents all the material flows within the cow milk supply chain for the whole of France, from supply sources to the various final uses, for the 3 years studied in the SOCLE project: 2015, 2019 and 2023 (select the desired year in the timeline below the diagram). Three levels of detail are available: the first gives the overview, the next ones break the steps down.
Supplies include the raw milk collected on farms, supplemented by imports and stock variation; an Indéterminé - Approvisionnements item carries the share that the data does not allow to be allocated. Processing starts with skimming and unfolds into workshops run product by product: whole and semi-skimmed milk, concentrated milk, milk powder, butter, cream, cow cheese and processed cheese, yoghurts and milk desserts, concentrated and powdered whey, concentrated buttermilk and buttermilk powder, natural milk components. Each product then goes to its packaging or its bulk marketing, two routes the diagram keeps apart. Co-products — buttermilk, whey, lactose — are tracked just like the products, as are the water consumed and then generated by the processes and the plant components entering some manufacturing steps. Outlets are split between human food (at home, out-of-home catering, other agri-food industries) and animal feed, to which are added exports and an Indéterminé - Débouchés item.
The thickness of the flows makes it possible to identify the main recovery routes of the collected milk, the respective place of the major families of dairy products and the role of co-products in the balance of the chain. Switching units changes the reading: each unit redistributes the thicknesses between products, which is precisely why the chain is modelled in four units.