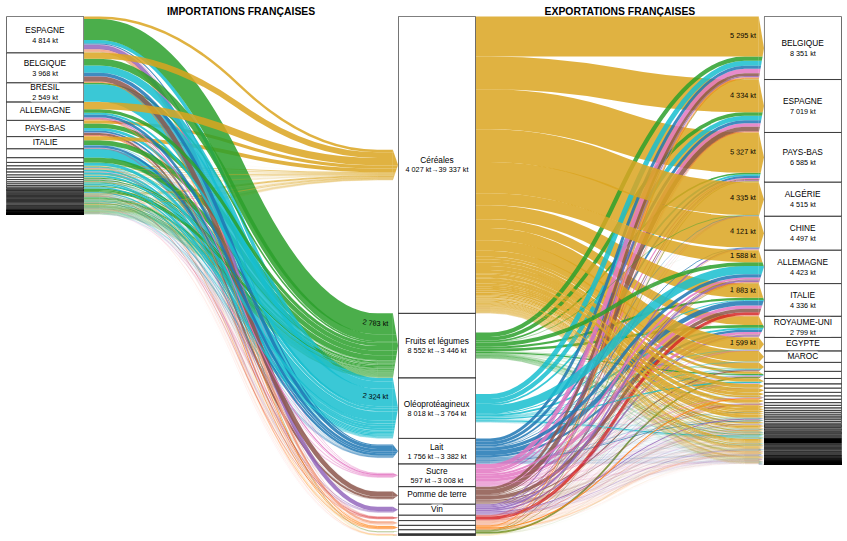
The portfolio consists of 45 Sankey diagrams (15 views × 3 years), accessible through the Supply chain and Year selectors at the top of the page. Each diagram represents, for the chosen supply chain and year, the import flows (on the left) and export flows (on the right) to the agricultural products concerned, aggregated according to the hierarchy levels selected via the "Partner level" and "Product level" filters.
Questions this deliverable sheds light on
This deliverable provides specific insights into several questions that are not directly addressed in the per-supply-chain diagrams:
- Import-export data detailed by region and by country — direct visualisation of the relative weight of each trade partner in French inbound and outbound flows, at every scale (World, Continents, Sub-regions, EU / Non-EU, Countries).
- Import-export data detailed by supply chain and by product — fine-grained breakdown of trade flows within each agricultural supply chain, from the supply-chain level down to individual HS4 products.
- Identification of the trade balance of a specific supply chain or product — immediate comparison of imported and exported volumes for a given supply chain (cereals, beef, milk, etc.) or a specific product (soft wheat, cheese, horse meat, etc.).
- Identification of the trade balance with a country or group of countries across all supply chains — accessible through the "All supply chains" view, which aggregates the 14 SOCLE supply chains and makes it possible to measure the overall agricultural trade balance with a given partner or set of partners (EU, non-EU, a specific continent, etc.).
- Identification of the trade balance for a given supply chain/product × region/country pair — the finest cross-analysis offered by the deliverable, making it possible to isolate, for example, soybean imports from Brazil, wine exports to Asia or cereal flows with North Africa.
Perimeter and differences with the other SOCLE deliverables
This deliverable relies on the raw French Customs data without supply-chain expert corrections, which sets it apart from the individual supply-chain models:
- No correction of re-exports (a product imported for re-export appears in both flows here).
- Coarser product granularity: HS4 (4 digits) instead of CN8 in the other SOCLE work packages.
- No import/export reconciliation (net balances are not computed).
- Time breakdown by calendar year (1 January — 31 December) instead of the crop year used for the "field crops" supply chains in the rest of SOCLE.
A getting-started help window is displayed when the page first loads and explains all of these points. It can be reopened at any time via the ? button at the top.