Pig meat
Pig meat
The pig meat supply chain is one of the leading French meat chains by volume. It relies on a large herd and highly concentrated slaughtering, and stands out through the dominant place of charcuterie and curing among its outlets: a large share of pig meat is intended for processing. The chain also generates a significant pool of co-products (the "fifth quarter"), recovered in animal feed, in industry and through rendering, and is part of sustained international trade.
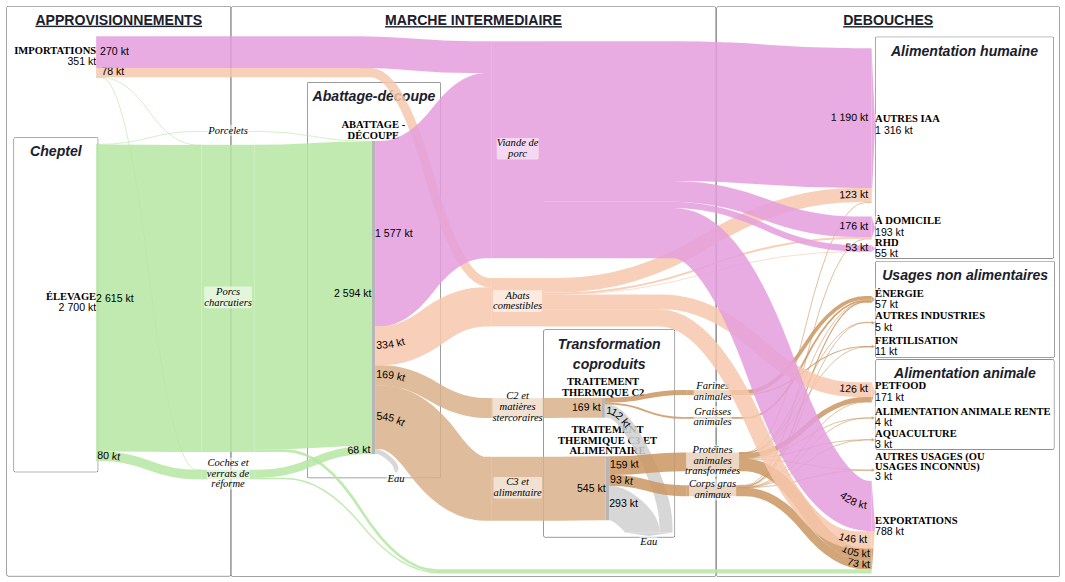
The flow diagram presenting the results for this supply chain, produced as part of the SOCLE project, offers a complete view of how material circulates through the chain, from supplies to final outlets. It is a Sankey-type representation: the thickness of the arrows is proportional to the quantities (in kilotonnes of live weight, kt), making it possible to grasp at a glance the relative weight of each segment.
Complete view of the results
This diagram aims to represent the supply chain as a whole at the most detailed level possible. Although some data could be mobilised at a finer level of detail than the one shown, it did not make it possible to guarantee complete data all along the chain: such data is therefore shown in aggregated form on the diagram.
The diagram represents all the material flows within the pig meat supply chain in France, from supply sources to the various final uses, for the 3 years studied in the SOCLE project: 2015, 2019 and 2023 (select the desired year in the timeline below the diagram).
Supplies include livestock from national farming — split into finishing pigs, cull sows and boars, and piglets — supplemented by imports and trade in live animals. These flows feed the slaughtering and cutting circuits. The intermediate market highlights the slaughtering and cutting operations and the separation between meat intended for human consumption and co-products (edible offal, digestive-tract contents, fats and residues destined for rendering). Part of these co-products is directed to thermal treatments before recovery as animal proteins and fats, meals and greases. The outlets include human food (at-home consumption, out-of-home catering, and agri-food industries — first and foremost charcuterie and curing, the main outlet for pig meat), animal feed (petfood, feed for productive livestock, aquaculture), non-food or industrial uses (energy, fertilisation, other industries), as well as exports.
The thickness of the flows makes it possible to identify the main recovery routes, the decisive weight of downstream meat processing, the structuring role of co-products in the balance of the chain, and the diversity of the final uses of the material produced by pig farming.
AF-Filières methodology: general principle and illustration through the diagrams
The AF-Filières (Supply Chain Flow Analysis) methodology, implemented in the SOCLE project, aims to reconstruct all the flows of a supply chain by aggregating, structuring and analysing all the available information. It consists in gathering all the relevant data about a given sector into a single, hierarchical model that links every piece of information together. This systematic cross-checking makes two essential operations possible: 1. checking the internal consistency of the data and, where necessary, reconciling it; 2. determining missing values, either precisely or as intervals when some indeterminacy remains.
The Sankey diagrams presented in the "Method and sources" section illustrate each step of this process, relying directly on the data actually used in the SOCLE model. They provide a concrete view of how the supply chain is reconstructed, step by step.
Part 1 — Data collection, qualification and structural completion of the model
(Associated diagram: Sources)
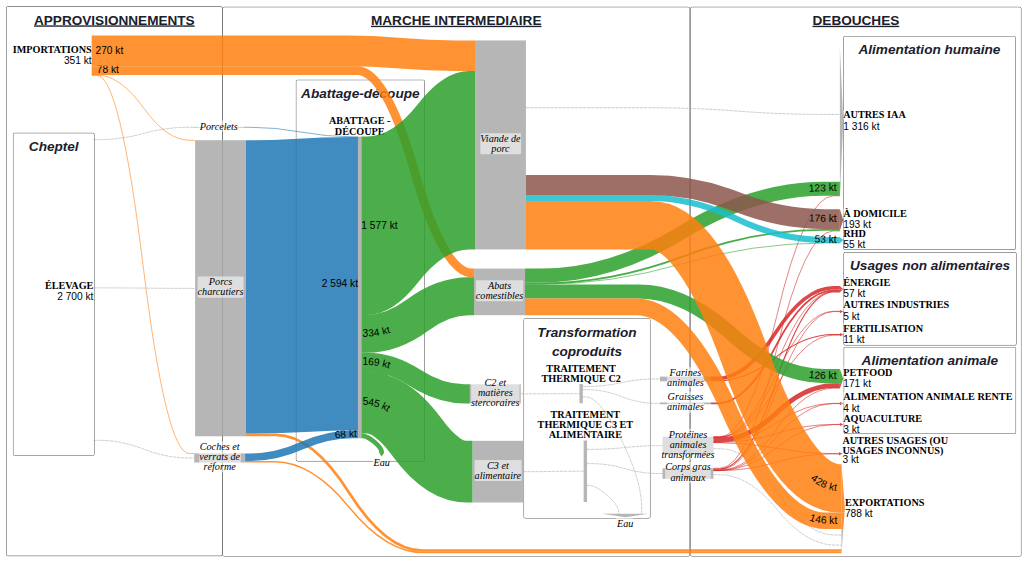
This first phase starts with an inventory of all the relevant public and sector-specific sources describing the agricultural supply chain in France (available years, nature of the data: direct values, min/max, coefficients, etc.). The associated diagram shows, for each documented flow, the sources used and their characteristics, giving an immediate reading of the well-documented areas and of those where information is scarcer. The diagram also makes it possible to display the type of data collected in the legend (use the colour selector to show it): direct value, minimum or maximum, or allocation and yield coefficients, which express a relationship between two flows rather than an absolute value. It is also possible to consult the raw data from the source directly, by referring to the corresponding sheet of the model's Excel file (the sheet name is available in the tooltip of each flow).
Because the collected data generally does not cover the whole supply chain, this step also includes structural completion: additional flows, not yet documented, are added to the model to ensure the continuity of the processing chains and to materialise the segments lacking information.
At the end of this phase, the whole knowledge perimeter is mapped: the flows for which data exists and those that will have to be determined later.
Part 2 — Validation, reconciliation and determination of the flows
(Associated diagram: Method)
Based on this complete structure, the flows for which reliable data exists are consolidated. When several sources converge, the collected values are retained as they are. When inconsistencies are detected (contradictory material balances, incompatible yields, etc.), a statistical discrepancy flow is added to the model: its value represents the difference between the collected data, making it easy to assess its magnitude relative to the flows involved, as well as the product or sector concerned.
Once the model has been made consistent, the missing flows can be determined using material balances, structural constraints and relationships between flows. Some flows thus obtain a precise value (called "determined"); others can only be defined through a min–max range when a lack of information remains. The associated diagram makes all of these situations visible: collected values, statistical discrepancies, computed values and indeterminacy intervals, where applicable.
Part 3 — Overall synthesis and confidence level
(Associated diagram: Confidence level)
The last diagram offers an overall view of the results, enriched with a global reliability indicator for each flow. This reliability is based on several criteria: quality and precision of the sources, closeness of the collected data to the project's perimeter, magnitude of the observed statistical discrepancies, width of the indeterminacy intervals, etc.
How to read the reliability levels:
- Reliable: data with a very low level of uncertainty, drawn from validated and consistent sources.
- Robust: solid data, confirmed by several elements or methods, usable with confidence.
- Probable: plausible data, based on serious elements but carrying notable uncertainty.
- Approximate: data giving the right order of magnitude, but without any guarantee of precision.
- Indicative: data provided for information only, with a high level of uncertainty.
This diagram makes it possible to identify at a glance the segments of the supply chain that are well documented and those that remain exploratory.